The Campaign
Climate change exacerbates and increases the incidence of extreme heat events. According to NOAA, extreme heat consistently leads to the deadliest outcomes of all weather events annually. Understanding how heat impacts our communities is increasingly necessary.
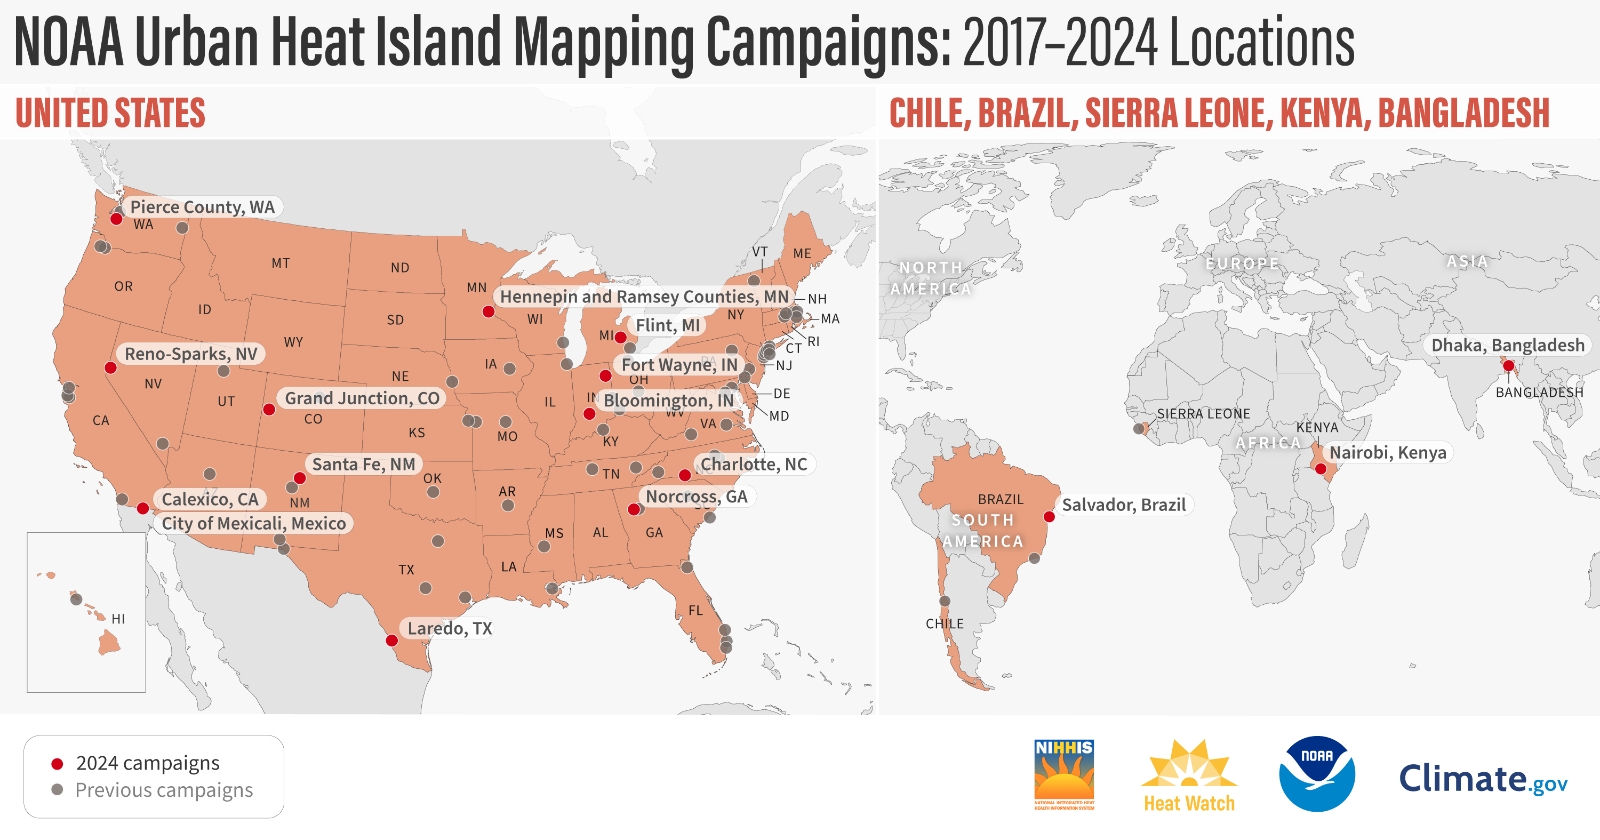
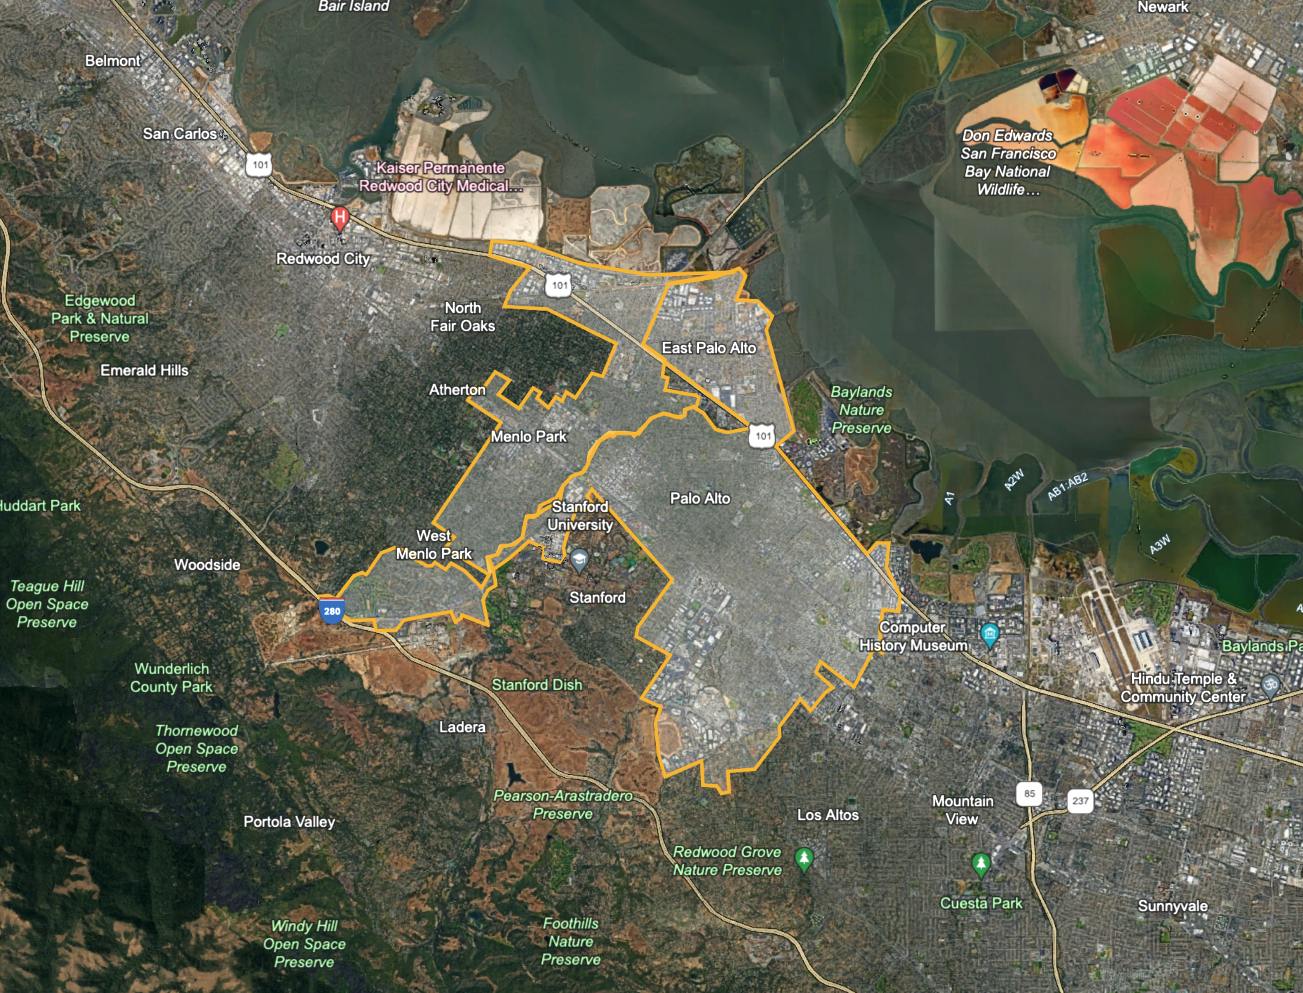
As part of the National Oceanic Atmospheric Administration’s (NOAA) Urban Heat Island Mapping initiative, and with the contributions of the Schmidt Family Foundation, the Palo Alto Student Climate Coalition (PASCC) is working with Acterra, CAPA Strategies, the City of Palo Alto, the City of East Palo Alto, the Mayor of Menlo Park, Youth Community Service, and Belle Haven Action to map the distribution of heat throughout the Bay Area. The purpose of the 2024 Bay Area Heat Mapping Campaign is to measure the temperature and humidity across three cities: Menlo Park, East Palo Alto, and Palo Alto.
Our Campaign is part of a larger initiative with NOAA and NIHHIS.
The Task
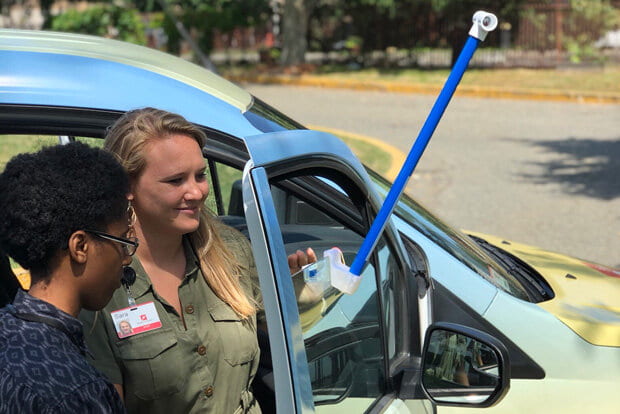
On one of the hottest days of the summer (a Saturday in late August/early September), volunteers drive along pre-planned routes with sensors attached to their cars, recording temperature, humidity, and GPS location data throughout the morning, afternoon, and evening in Palo Alto, East Palo Alto, and Menlo Park.
With the data volunteers collect, temperature maps are created to support better project design and policies that address heat-related health issues across the region. The data helps decision-makers and government officials with urban planning and identifying areas most vulnerable to heat — informing climate, urban forestry, housing, and other policies to improve the lives of Bay Area residents.

Urban Heat Island Effect
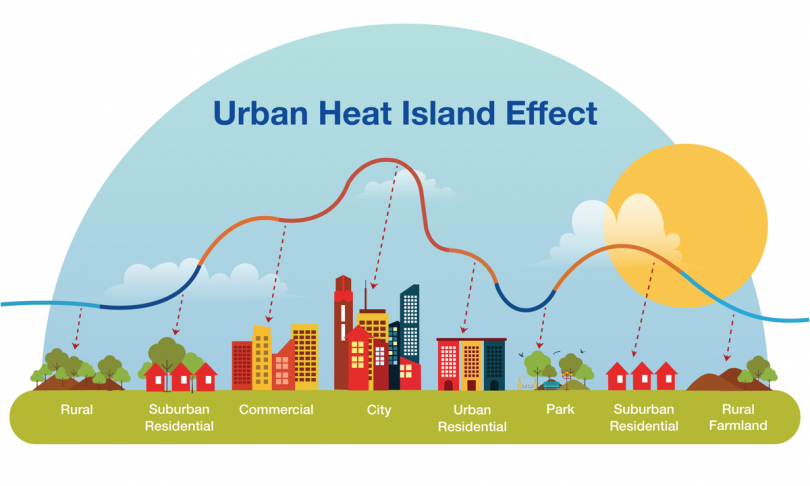
Urban areas are especially prone to high temperatures due to a combination of impervious surfaces (buildings and roads), limited green spaces, and heat-producing factors like car use and industrial activity. This problem, known as the "Urban Heat Island Effect," can create issues for human health, infrastructure, and quality of life. Understanding how temperatures vary based on qualities of the natural and built landscape can inform how we reduce the impacts of rising summer temperatures in our communities.
Our Partners